No simple view of the future is perfect. This is what guides our use of scenarios. The simplest solution – a forecast – simply projects forwards from assumptions to a single point position of the future. They are almost always inaccurate. Scenarios provide us with a nuanced view of the future – one where, depending on the variables, a number of futures are possible. Whilst none of them may come true in total, taking an abstract of the commonalities between those futures provides a consensus view of what may happen. Each scenario is a view of what, under the chosen variables, may happen. Preparing for the commonalities, and being aware of the range of potential futures, allows governments, companies and organisations to avoid preparing for a single point forecast and instead, have a robust, resilient view of what the future may bring in a range of possible futures.
We tend to represent this range of futures in a scenario cross. Two variables, usually chosen in a workshop by a varied group of participants after a rigorous process of horizon scanning and interviews, form the axes of the cross.
Here’s an example – from a recent SAMI project for the European Commission.
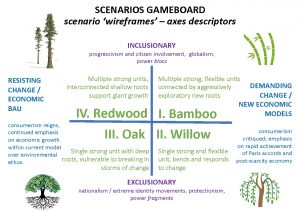
It’s important to note that the variables which form the axes come from different classes. That is to say, were one thinking of the usual PESTLE/STEEP categories, the axes should come from different key indicators; political should not map against political, nor social against social and so on. The reason is simple – one wants to establish two ranges where the categories do not match each other. Were they to come from the same category, the danger is that they would match – in which case one develops a scenario set of minimal difference.
By selecting opposing categories, we establish a tension between the axes, and that tension is what allows us to form discrete, different futures in each scenario.
(One of the ways we ensure this happens is by ensuring that the choice before the workshop is clearly split into different categories, so that the workshop considers and chooses from different categories rather than similar ones. Voting, such as is available in Miro, permits us to do this easily).
At the conclusion of this process, we generate four distinct scenarios, as quadrants within the scenario set. \We populate these futures, with implications drawn from the positions on the axes of each quadrant, and then derive from those potential futures the implications for the organisation.
But what happens if there are three variables? Three factors that are equally important to the client, and which weigh equally importantly in the future of their organisation?
All futures structures such as scenarios are only essentially a slice through the future. They are our best estimate, given the chosen variables, of what – in the case of a scenario cross, four – potential futures may look like. What though if we want a slice which must include a particular variable, or where the client requires three PESTLE components to work together?
In this case, we use a scenario space. Rather than opposing two variables against each other on a flat plane, to produce a cross and four scenarios, each of the three variables forms an axis of a three-dimensional square. We move from four quadrants in a scenario cross to, essentially, an infinite number of points within a three-dimensional space.
The space below has three dimensions such as green culture, green innovation and the economy, as shown below, which were derived for the European Agency for Safety and Health at Work, when looking at scenarios for new and emerging risks for health and safety in green jobs.
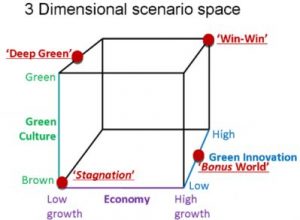
This has one major advantage – it enables us to introduce a third variable and map our two selected variables against it. And it has one major disadvantage – an infinite number of points in a three-dimensional space is no way to construct clearly understandable, and explicable scenarios.
So we do what we do with a two-dimensional scenario set: we divide it into manageable parts. Dividing each side equally will give us 8 scenario spaces, each of which will be range bound, and can now be described as one would within an ordinary two-dimensional scenario set – except that these individual scenarios will take account of the three variables which form their axes. However, as my colleague Gill Ringland has pointed out, “Generally, it is highly unlikely that developing eight scenarios, one at each corner, would be practical or useful, and in this case four scenarios were developed at selected points on the axes to provide plausible and differentiated scenarios.”
If we have more than three variables, it becomes incredibly complex to map visually – mostly because trying to represent four dimensional spaces do not naturally map either to our usual ways of representing them on a screen or paper, and because it is quite difficult to comprehend without a grip on mathematics (there is a useful image of a tesseract, a simple four dimensional space, here).
Accordingly, we use morphological analysis, which tabulates the variables against each other. This gives useful results, but ones which can be difficult to manipulate or explain. An excellent example can be found in the journal Technical Forecasting and Social Change 126:116-125, illustrating an case developed for Norwegian defence planning. The author, Iver Johansen, says “Each parameter is defined in terms of an exhaustive set of possible states or values,” in a paper which gives a “method for characterizing the entire solution space of future outcomes in a given subject field, and suggests a process for classification of an all-encompassing and mutually exclusive set of scenario classes.”
At SAMI, we work with all three models – scenario crosses, scenario spaces, and morphological analysis. We prefer scenario crosses – they are easier for clients unfamiliar with scenario thinking to use, and – in most cases – four scenarios are more than adequate to gain a rounded, useful view of the possible future. They enable us, and our clients, to develop a robust approach to future opportunities and risks. But they are one tool of many – and for truly complex problems, it is useful to have equally complex tools.
Written by Jonathan Blanchard Smith, SAMI Fellow and Director
The views expressed are those of the author(s) and not necessarily of SAMI Consulting.
Future-prepared firms outperform the average by 33% higher profitability and 200% higher growth. SAMI Consulting brings 30 years of experience delivering foresight, futures and scenario planning – enabling companies and organisations make “robust decisions in uncertain times”. Find out more www.samiconsulting.co.uk.
If you enjoyed this blog from SAMI Consulting, the home of scenario planning, please sign up for our monthly newsletter at newreader@samiconsulting.co.uk and/or browse our website at https://www.samiconsulting.co.uk

